
The new Cribl Microsoft IO Pack contains everything you need to ingest MS Entra data (see here for the extensive list of available data types) and route it to your Destination(s) of choice. Authentication, audit, provisioning, risky users, etc. can all be ingested via a single Event Hub Source, processed, and sent to the Global Routes for additional processing.
How does this compare to the Microsoft Graph Rest Collector IO Pack? In short, it is considerably more comprehensive in the data types it can gather. For example, the Graph Pack can only gather Interactive Signin logs (the only kind available from the MS Graph API) while the Entra Pack gathers Non-Interactive, Service Principal, and Managed Identity Signin logs in addition to many other log types. The only trade-off is that the Entra Pack is more complex to deploy… but this post should make that process somewhat simpler!
Deployment Guide
Prior to deploying the Entra Pack, your MS Entra Administrator must provision an Event Hub, create an Entra Application, and configure Diagnostic Logging to send data to the Event Hub.
This section is very detailed because I’ve often found that a customer’s Entra Admin has not done this before, so I’ve had to walk them through the configuration process! If this happens to you, this guide should have everything they need to get things setup on the Entra side.
Provision an Event Hub
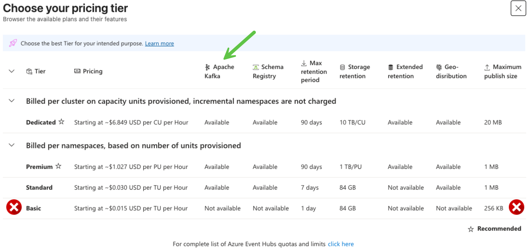
An Event Hub lives inside of an Event Hub Namespace. An Event Hub Namespace has a couple Cribl-related configuration options, the most important of which is the Pricing Tier. The tier options are shown below – note that Cribl requires Apache Kafka support, which means you cannot use the Basic Tier!
Below is the main creation screen in the Azure Portal – depending on your organization’s size you will likely need more than one Throughput Unit, though. See this Cribl Blog entry for recommendations. Also note that you cannot change the pricing tier after the Namespace is created!
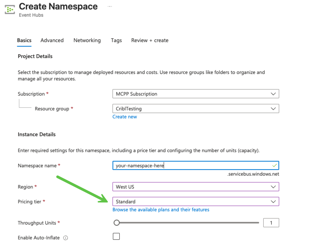
You will want to save the “Namespace name” – you will need it later in Cribl. Once you’ve created a Namespace, you’ll need to create an actual Event Hub:
For guidance on setting Partition count, see this Cribl Blog and the Microsoft docs.

The last step is to copy the Primary (or Secondary) connection string for later use in Cribl:

In summary, you will need the following information to Configure the Event Hub source in Cribl:
- Event Hub Namespace name e.g.
nthentradiags.servicebus.windows.net. This can be found on the Namespace Home Page. - Event Hub name.
- Primary (or Secondary) connection string – format looks like
Endpoint=sb://<namespace>.servicebus.windows.net/;SharedAccessKeyName=RootManageSharedAccessKey;SharedAccessKey=<redacted>.
Configure Activity Logging into an Azure Event Hub
Now that you have an Event Hub, you need to configure Diagnostic Logging to it. The first step is to register a new Application in the MS Entra Hub:
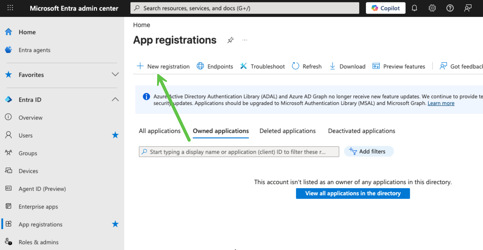
Give the Application an appropriate name and then select “Register”. Once the new Application has been created, you need to assign it (at a minimum) the Event Hubs Data Sender Role:

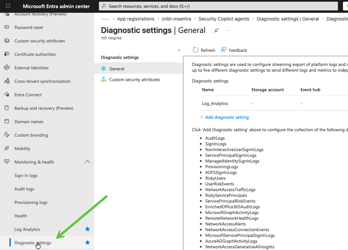
The final step is to configure Diagnostic Settings to send data to the Event Hub. Navigate to Monitoring and Health->Diagnostic Settings and select “Add diagnostic setting”:
From there, select the logs you wish to send, choose “Stream to an event hub”, and select the Event Hub you created in the previous step:
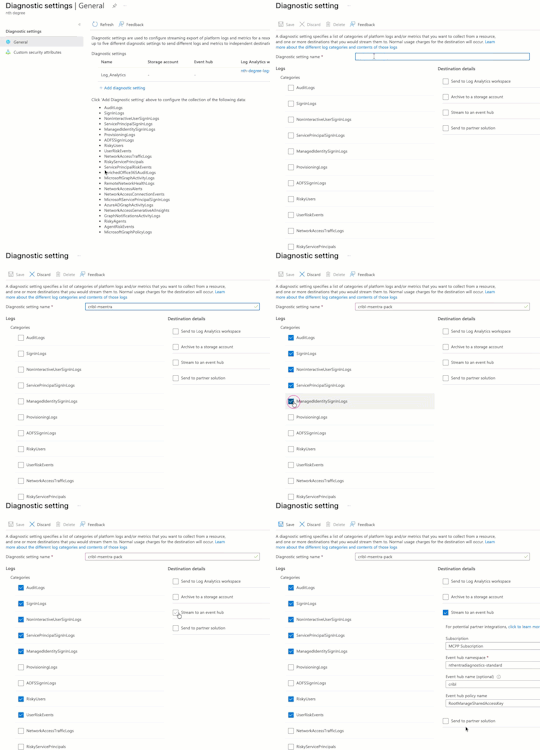
See the Entra Pack README for the logs that are supported OOB. Adding support for additional logs is mostly a matter of ensuring proper timestamping in the pre-processing pipeline _cribl_ms_entraid_preprocess.
Configure Pack Event Hub Source
To configure the Pack’s included Event Hub Source, navigate to it via Sources->Azure Event Hubs->in_msentra_diagnostic_logs. Enter your Namespace and Event Hub Name like so – be sure to enable the Event Hub source in this screen as well:

In the Authentication tab, choose “PLAIN” as the SASL mechanism, “Manual” for the Authentication method, and paste your connection string in the “Password” box:
OAuth is another option, but requires additional steps on the Azure side to setup.
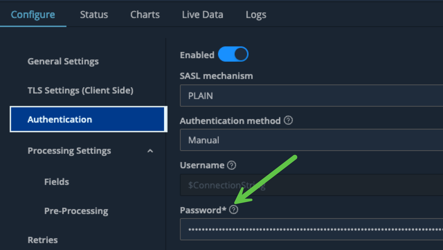
Click save and then perform a Commit/Deploy. If everything is configured correctly you will see a green checkmark next to the Event Hub!
Verification
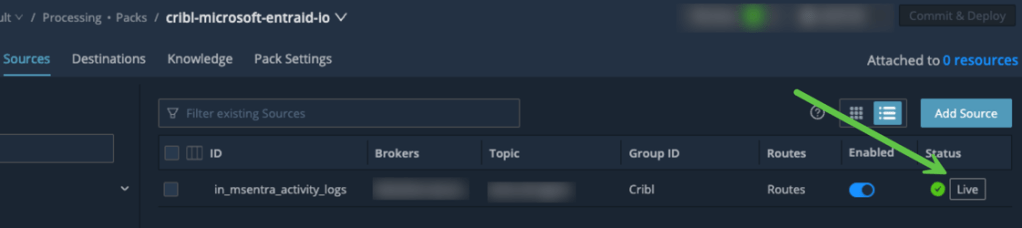
Once you get the green check mark, click on the “Live” button to verify that Entra data is being read by the Event Hub Source:
Destination Configuration
The Pack’s routes come pre-configured to send all events to the Worker Group’s Routes. This means that you must add a routing entry that sends the Pack data to your desired Destination. Since you also must choose a pipeline, you can either just use passthru or create your own “Pack Post-processing” pipeline!
The Destination drop-down in Routes will not appear until you enable the Event Hub Source. After you enable it, though, the Routes will already show “Send to Worker Group Routes”.
If you are upgrading from a previous version of the Pack and already have a Default Destination configured, you can update the Pack pipeline’s Destinations to default:default to continue using this configuration.
Your other option is to add a Destination directly into the Pack. While not ideal, it works just fine.
Event Breaking and Timestamping
Event Hub Sources do not (currently) support Event Breakers, so the Pack uses a Pre-Processing Pipeline named _cribl_ms_entraid_preprocess to perform both event breaking and timestamp recognition:
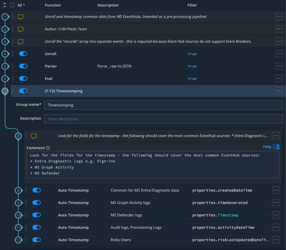
The pipeline first Unrolls the records array into separate events and then performs timestamp recognition based on what kind of data is in the event. For example, Signin logs are timestamped based on the properties.createdDateTime field, while Risky User events are timestamped based on the properties.riskLastUpdatedDateTime field. This section is what you will need to modify if you are ingesting events not already covered.
Cribl has an Event Breaker function but I’ve found using it for arrays like this is more cumbersome because you must move the data to _raw and then stringify it before applying the Event Breaker. Unless you need something only an Event Breaker provides, I find doing it via unroll/timestamp to be simpler.
Configuration Options
The Pack includes a few interesting options for data reduction, filtering, and modification. All three options are controlled by variables:
enable_filter_conditional_access_policies: Defaults totrue.enable_sample_graph_activity:Defaults totrue.enable_move_properties_array: Defaults tofalse.
Conditional Access Policy Filtering
Each Entra Signin and Non-InteractiveSignIn log entry contains an often-times large array of all configured Conditional Access Policies – even those that are disabled or were not applied. This leads to a significant fraction of the event having little to no value. For example, the following Policy entry is useful:

Whereas the following two are not:

The Entra Pack by default filters out Policies that were not a success or failure using the following short Code Function. Note that it also adds a field for the total number of Policies:
try {
    // List of appliedConditionalAccessPolicies results to keep
    const keepResults = ['success', 'failure', 'reportOnlyFailure', 'reportOnlySuccess'];

   // Add a field for total # of policies
    __e.properties.appliedConditionalAccessPoliciesNum = (__e.properties.appliedConditionalAccessPolicies.length).toString();

    // Filter out unneeded appliedConditionalAccessPolicies entries
    __e.properties.appliedConditionalAccessPolicies = __e.properties.appliedConditionalAccessPolicies.filter(policyItem => keepResults.includes(policyItem.result));

} catch (err) {
  __e.CRIBLERR = String(err);
}
Real world data shows reductions of 30%-60% in the size of Signin log entries – which is a big win given that these logs are high volume.
MS Graph Activity Sampling
If you choose to send MS Graph Activity logs to your Event Hub via Diagnostic Settings, you will likely want to down-sample them due to their sheer volume, especially successful (HTTP status 200) requests.
This option is implemented by a pipeline with two Sampling functions:
- The first Samples 1 in every 250
properties.responseStatusCode == 200events. While this seems high, testing in several real-world environments showed it to be a reasonable tradeoff. YMMV, so adjust accordingly. - Remaining events are Dynamically Sampled using a combination of
userAgentandresponseStatusCode.This ensures that, for example, user agents that don’t fail often are not overwhelmed by a misconfigured Graph API client!
Properties Array “Hoisting”
If you use Cribl Search, then this optimization will make your Search Life simpler. When sending Entra data via an Event Hub, most of the interesting data is buried inside a properties array. For example, the following is what a Non-Interactive Signin entry looks like in Splunk. The only useful top-level fields are callerIpAddress, Identity, and resultSignature. The properties array contains dozens of useful fields and arrays like location details, risk info, MFA info, etc.!
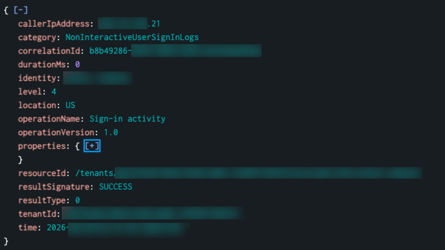
Wouldn’t it be better to “hoist” the entries in the properties array into the main event – given that there are no name collisions? That is what this optimization does using the following Code Function:
try {

   // Copy all keys from properties into the main JSON body
   let properties = Object.entries(__e.properties);
   for (let [key, value] of properties) {
         __e[key] = value;
   }
   delete __e['properties'];

} catch (error) {
  __e['cribl_code_error'] = String(error);
}
The main caveat is that this will break Splunk – and likely most other SIEM’s – field processing. However, if you are using Cribl Search then this will make your searches simpler!
Dennis Morton
Principal Consultant
dmorton@nthdegree.io